Market Outlook
November 30, 2017
Market Cues
Domestic Indices
Chg (%)
(Pts)
(Close)
Indian markets are likely to open negative tracking global indices and SGX Nifty.
BSE Sensex
(0.0)
(16)
33,603
The US stocks turned in a mixed performance during trading on Wednesday
Nifty
(0.1)
(9)
10,361
following the broad based rally seen in the previous session. The Dow Jones
Mid Cap
(0.2)
(28)
17,011
industrial averageclosed at an all-time high on Wednesday as investors bet the U.S.
Small Cap
(0.0)
(3)
18,211
economy's momentum would continue. The U.S. economy has picked up steam this
Bankex
(0.4)
(107)
29,180
year, growing at an annualized rate of more than 3 percent each of the past two
quarters. The Dow climbed 0.4 percent to 23,941, the Nasdaq plunged 1.3 percent
to 6,824 and the S&P 500 edged down less than a tenth of a percent to 2,626.
Global Indices
Chg (%)
(Pts)
(Close)
In UK, the benchmark FTSE 100 was down 0.9 percent at 7,394 as sterling rallied to
Dow Jones
0.4
104
23,941
a two-month high following reports that Britain and the European Union had agreed
Nasdaq
(1.3)
(88)
6,824
the outlines of a Brexit divorce bill of 50 billion pound. Settling the Brexit bill is a
FTSE
(0.9)
(67)
7,394
crucial condition for moving talks on to future relations including a future free trade
Nikkei
0.5
111
22,597
agreement.
Hang Seng
(0.2)
(57)
29,624
The BSE Sensex and NSE nifty closed marginally lower on Wednesday ahead of
Shanghai Com
0.1
4
3,338
November future and options expiry and September-quarter GDP data. A Reuters
poll of 52 economists over the past week shows GDP growth likely rose to 6.4%
Advances / Declines
BSE
NSE
from a year ago in the 2QFY18, from 5.7% in 1QFY18. BSE Sensex closed lower by
Advances
1,351
807
16 points at 33,603, while the Nifty 50 edged down 9 points to close at 10,361.
Declines
1,386
939
News Analysis
Unchanged
134
67
NYSIF selects Majesco Billing on Majesco CloudInsurer
Bajaj Quadricycles, not enough to fuel a rally
Volumes (` Cr)
Detailed analysis on Pg2
BSE
4,237
NSE
28,727
Investor’s Ready Reckoner
Key Domestic & Global Indicators
Net Inflows (` Cr)
Net
Mtd
Ytd
Stock Watch: Latest investment recommendations on 150+ stocks
FII
3,004
19,621
58,073
Refer Pg5 onwards
MFs
2,326
3,825
99,236
Top Picks
CMP
Target
Upside
Top Gainers
Price (`)
Chg (%)
Company
Sector
Rating
(`)
(`)
(%)
Hathway
43
11.3
Blue Star
Capital Goods
Buy
722
867
20.1
Dewan Housing Finance
Financials
Buy
618
712
15.2
Sobha
591
10.0
Asian Granito
Other
Accumulate
505
570
12.9
Religare
60
9.6
Navkar Corporation
Other
Buy
185
265
43.2
Hcl-Insys
52
6.4
KEI Industries
Capital Goods Accumulate
388
425
9.6
Hexaware
336
5.8
More Top Picks on Pg4
Key Upcoming Events
Top Losers
Price (`)
Chg (%)
Previous
Consensus
Date
Region
Event Description
Rtnpower
8
(4.4)
Reading
Expectations
Nov30
Germany Unemployment change (000's)
(11.00)
(10.00)
Rcom
12
(3.5)
Nov30
US
Initial Jobless claims
239.00
240.00
Dcbbank
184
(3.4)
Nov30
China
PMI Manufacturing
51.60
51.40
Trent
340
(3.3)
Dec01
Germany PMI Services
54.90
Sail
78
(3.2)
Dec01
Germany PMI Manufacturing
62.50
62.50
As on November, 29 2017
More Events on Pg7
Market Outlook
November 30, 2017
News Analysis
NYSIF selects Majesco billing on Majesco Cloudinsurer
Majesco has been selected as a billing solution provider by New York State
Insurance Fund (NYSIF). Majesco is a global provider of core insurance software
and consulting services for insurance business transformation. As per the plan,
Majesco will help NYSIF to convert their legacy systems onto Majesco Billing on
Majesco CloudInsurer, This provides a single platform for the business. The
advanced architecture platform will enable integrate their large number of banks
and payment channels, while supporting regulatory requirements. Majesco has
indicated that the insurance market continues to evolve and adapt to new
customer demands and billing is increasingly taking the lead to meet these rapidly
emerging new expectations and demands. Billing is no longer a back office
function and is front and center to the customer experience. Company remains
bullish on the growht and margin trajectory going ahead.
Bajaj Quadricycles, not enough to fuel a rally
Bajaj Auto has been waiting for long to launch its quadricycle which has been
delayed due to the regulatory hurdles. The company already has a capacity of
about 25,000 quadricycles and it currently exports its quadricycles to several
countries. While this is a sentiment booster news, it needs to be seen whether
Bajaj’s quadricycle is BSIV compliant as this product has been developed several
years earlier while BSIV norms kicked in this year. In case of a positive regulatory
ruling and at a 50% capacity sales in India, Bajaj can generate <1% of its revenue
from this product so we don’t believe that besides minor improving in the
sentiment, there is not enough thrust in this to see a rally in the stock.
Economic and Political News
Indian economic growth set to end five-quarter slide
Indian inflation likely to rise, interest rates won't, economists say
India's Q2 GDP growth seen picking up to 6.4%
Corporate News
SBI to increase rates on deposits of `1cr and above by 100 basis points
effective today.
Infosys Finacle launches blockchain-based trade finance solution for banks.
Maithan Alloys completes acquisition of Salanpur Sinters and Anjaney
Minerals.
Hyundai to enter electric vehicle race in India with Ioniq brand
Yes Bank sets up $1 billion debt programme to raise money
Affordable housing scheme powers home sales in Q2
Allahabad Bank cuts MCLR by 5 basis points across tenures.
Market Outlook
November 30, 2017
Top Picks HHHHH
Market Cap
CMP
Target
Upside
Company
Rationale
(` Cr)
(`)
(`)
(%)
Strong growth in domestic business due to its leade`hip
in acute therapeutic segment. Alkem expects to launch
Alkem Laboratories
23,402
1,957
2,125
8.6
more products in USA, which bodes for its international
business.
We expect the company would report strong profitability
Asian Granito
1,519
505
570
12.9
owing to better product mix, higher B2C sales and
amalgamation synergy.
Favorable outlook for the AC industry to augur well for
Cooling products business which is out pacing the
Blue Star
6,921
722
867
20.1
market growth. EMPPAC division's profitability to
improve once operating environment turns around.
With a focus on the low and medium income (LMI)
consumer segment, the company has increased its
Dewan Housing Finance
19,387
618
712
15.2
presence in tier-II & III cities where the growth
opportunity is immense.
Loan growth is likely to pick up after a sluggish FY17.
Lower credit cost will help in strong bottom-line growth.
Karur Vysya Bank
6,998
116
180
55.4
Increasing share of CASA will help in NIM
improvement.
High order book execution in EPC segment, rising B2C
KEI Industries
3,040
388
425
9.6
sales and higher exports to boost the revenues and
profitability
Expected to benefit from the lower capex requirement
Music Broadcast
2,132
374
434
16.1
and 15 year long radio broadcast licensing.
Massive capacity expansion along with rail advantage
Navkar Corporation
2,785
185
265
43.2
at ICD as well CFS augur well for the company
Strong brands and distribution network would boost
Siyaram Silk Mills
3,111
664
700
5.0
growth going ahead. Stock currently trades at an
inexpensive valuation.
Market leadership in Hindi news genre and no.
2
viewership ranking in English news genre, exit from the
TV Today Network
2,383
399
435
8.9
radio business, and anticipated growth in ad spends by
corporate to benefit the stock.
After GST, the company is expected to see higher
volumes along with improving product mix. The Gujarat
Maruti Suzuki
2,61,872
8,669
9,489
9.5
plant will also enable higher operating leverage which
will be margin accretive.
We expect loan book to grow at 24.3% over next two
GIC Housing
2,415
449
655
46.0
year; change in borrowing mix will help in NIM
improvement
We expect CPIL to report net Revenue/PAT CAGR of
~17%/16% over FY2017-20E mainly due to healthy
6900
311
399
28
growth in plywood & lamination business, forayed into
Century Plyboards India
MDF & Particle boards on back of strong brand &
distribution network.
We expect sales/PAT to grow at 13.5%/20% over next
LT Foods
1863
70
96
37
two years on the back of strong distribution network &
addition of new products in portfolio.
Source: Company, Angel Research
Market Outlook
November 30, 2017
Key Upcoming Events
Result Calendar
Date
Company
November 14, 2017
Tata Global, JK Tyre, CEAT, Jyoti Structures, Bank of Baroda, Reliance Capital, Corporation Bank, MOIL
November 15, 2017
Automotive Axle
Source: Bloomberg, Angel Research
Global economic events release calendar
Bloomberg Data
Date
Time
Country
Event Description
Unit
Period
Last Reported
Estimated
Nov 30, 2017
2:25 PMGermany Unemployment change (000's)
Thousands
Nov
(11.00)
(10.00)
7:00 PMUS
Initial Jobless claims
Thousands
Nov 25
239.00
240.00
6:30 AMChina
PMI Manufacturing
Value
Nov
51.60
51.40
Dec 01, 2017
2:25 PMGermany PMI Services
Value
Nov F
54.90
2:25 PMGermany PMI Manufacturing
Value
Nov F
62.50
62.50
Dec 05, 2017
3:00 PMUK
PMI Manufacturing
Value
Nov
56.30
56.50
3:30 PMEuro Zone Euro-Zone GDP s.a. (QoQ)
% Change
3Q F
0.60
Dec 06, 2017
2:30 PMIndia
RBI Reverse Repo rate
%
Dec 6
5.75
5.75
2:30 PMIndia
RBI Repo rate
%
Dec 6
6.00
6.00
2:30 PMIndia
RBI Cash Reserve ratio
%
Dec 6
4.00
4.00
Dec 08, 2017
3:00 PMUK
Industrial Production (YoY)
% Change
Oct
2.50
India
Imports YoY%
% Change
Nov
7.60
India
Exports YoY%
% Change
Nov
(1.10)
China
Exports YoY%
% Change
Nov
6.90
7:00 PMUS
Change in Nonfarm payrolls
Thousands
Nov
261.00
198.00
Source: Bloomberg, Angel Research
Market Outlook
November 30, 2017
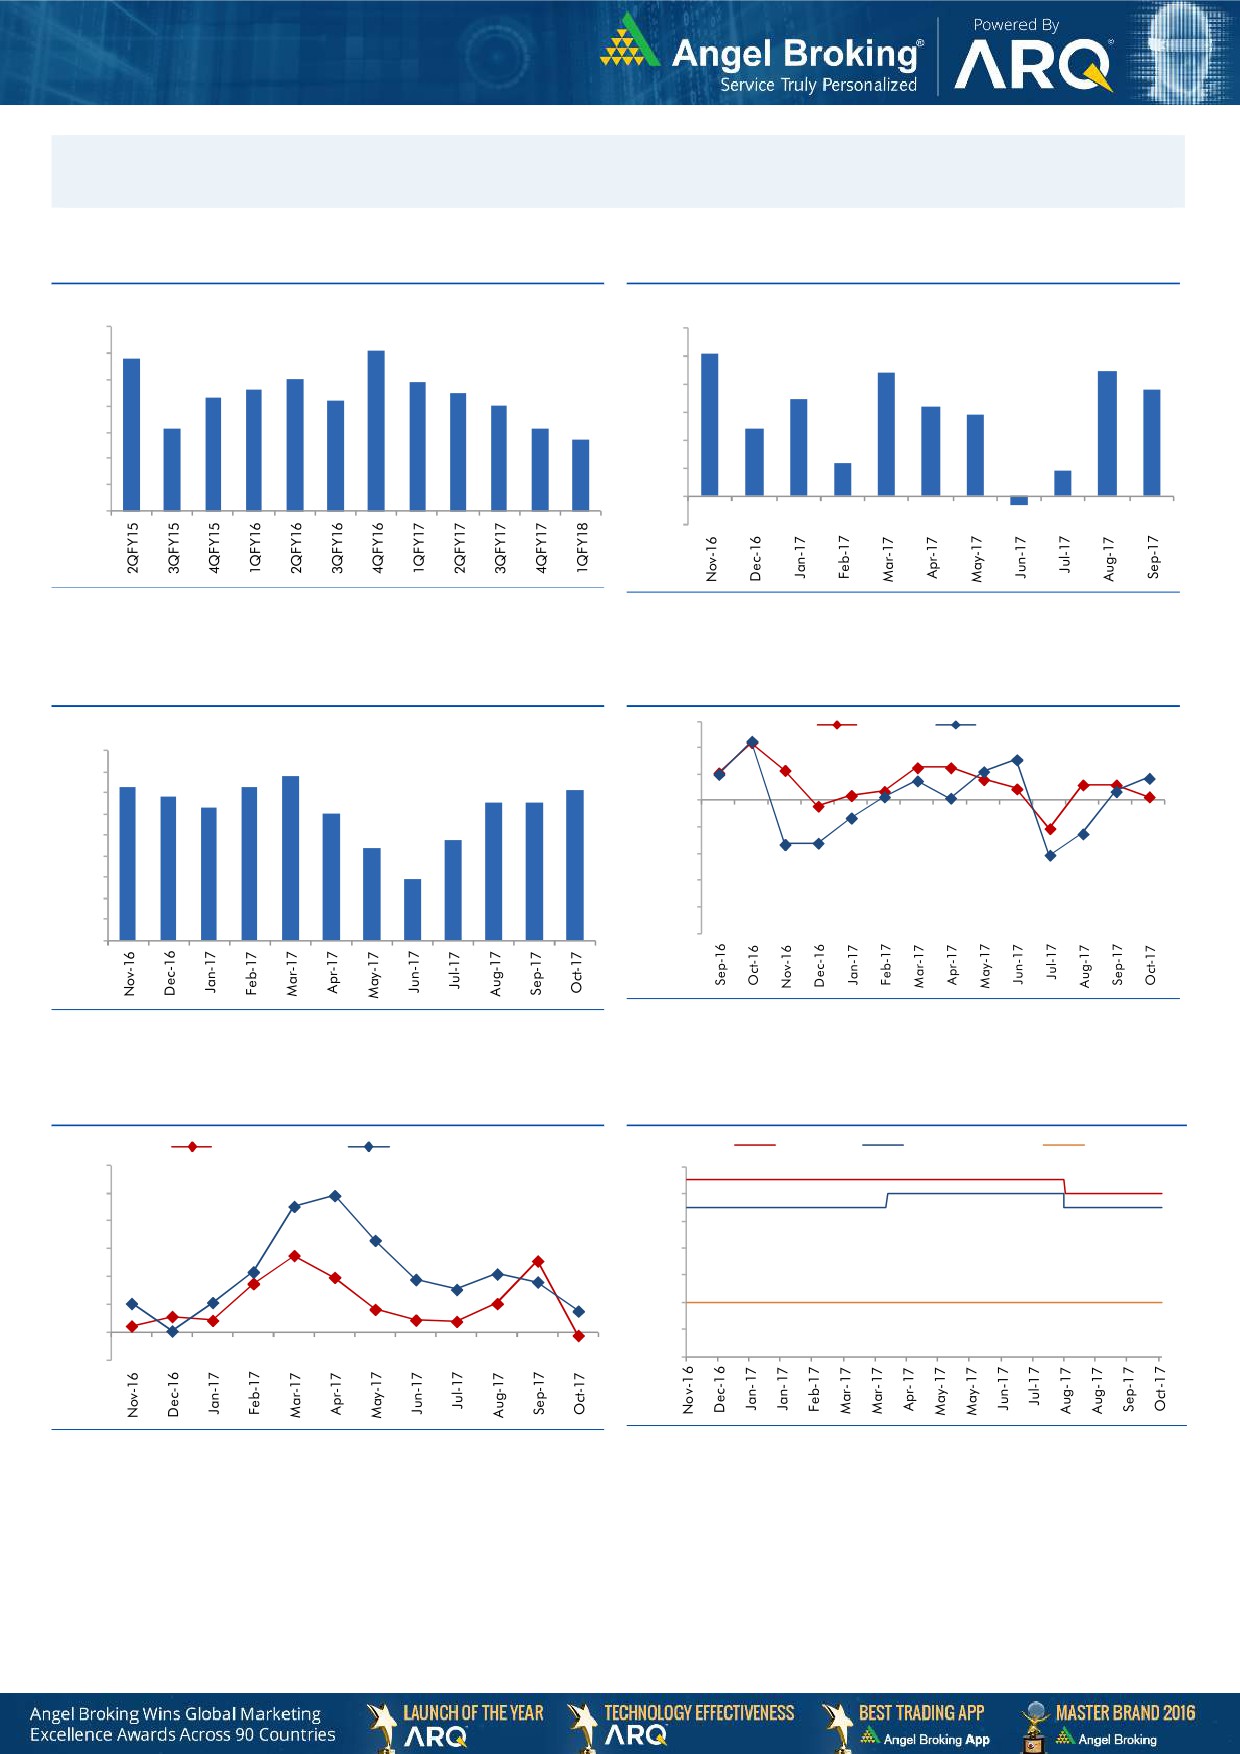
Macro watch
Exhibit 1: Quarterly GDP trends
Exhibit 2: IIP trends
(%)
(%)
10.0
6.0
9.1
5.1
8.8
9.0
5.0
4.4
4.5
8.0
7.9
7.6
7.5
3.8
8.0
7.3
3.5
7.2
7.0
4.0
3.2
2.9
7.0
6.1
6.1
3.0
2.4
5.7
6.0
2.0
1.2
5.0
0.9
1.0
4.0
-
3.0
(1.0)
(0.3)
Source: CSO, Angel Research
Source: MOSPI, Angel Research
Exhibit 3: Monthly CPI inflation trends
Exhibit 4: Manufacturing and services PMI
56.0
Mfg. PMI
Services PMI
(%)
4.5
54.0
3.9
4.0
3.6
3.7
3.6
52.0
3.4
3.2
3.3
3.3
3.5
3.0
50.0
3.0
2.4
48.0
2.5
2.2
2.0
46.0
1.5
1.5
44.0
1.0
42.0
0.5
40.0
-
Source: Market, Angel Research; Note: Level above 50 indicates expansion
Source: MOSPI, Angel Research
Exhibit 5: Exports and imports growth trends
Exhibit 6: Key policy rates
(%)
Exports yoy growth
Imports yoy growth
(%)
Repo rate
Reverse Repo rate
CRR
60.0
6.50
50.0
6.00
40.0
5.50
30.0
5.00
20.0
4.50
10.0
4.00
0.0
3.50
(10.0)
3.00
Source: Bloomberg, Angel Research
Source: RBI, Angel Research
Market Outlook
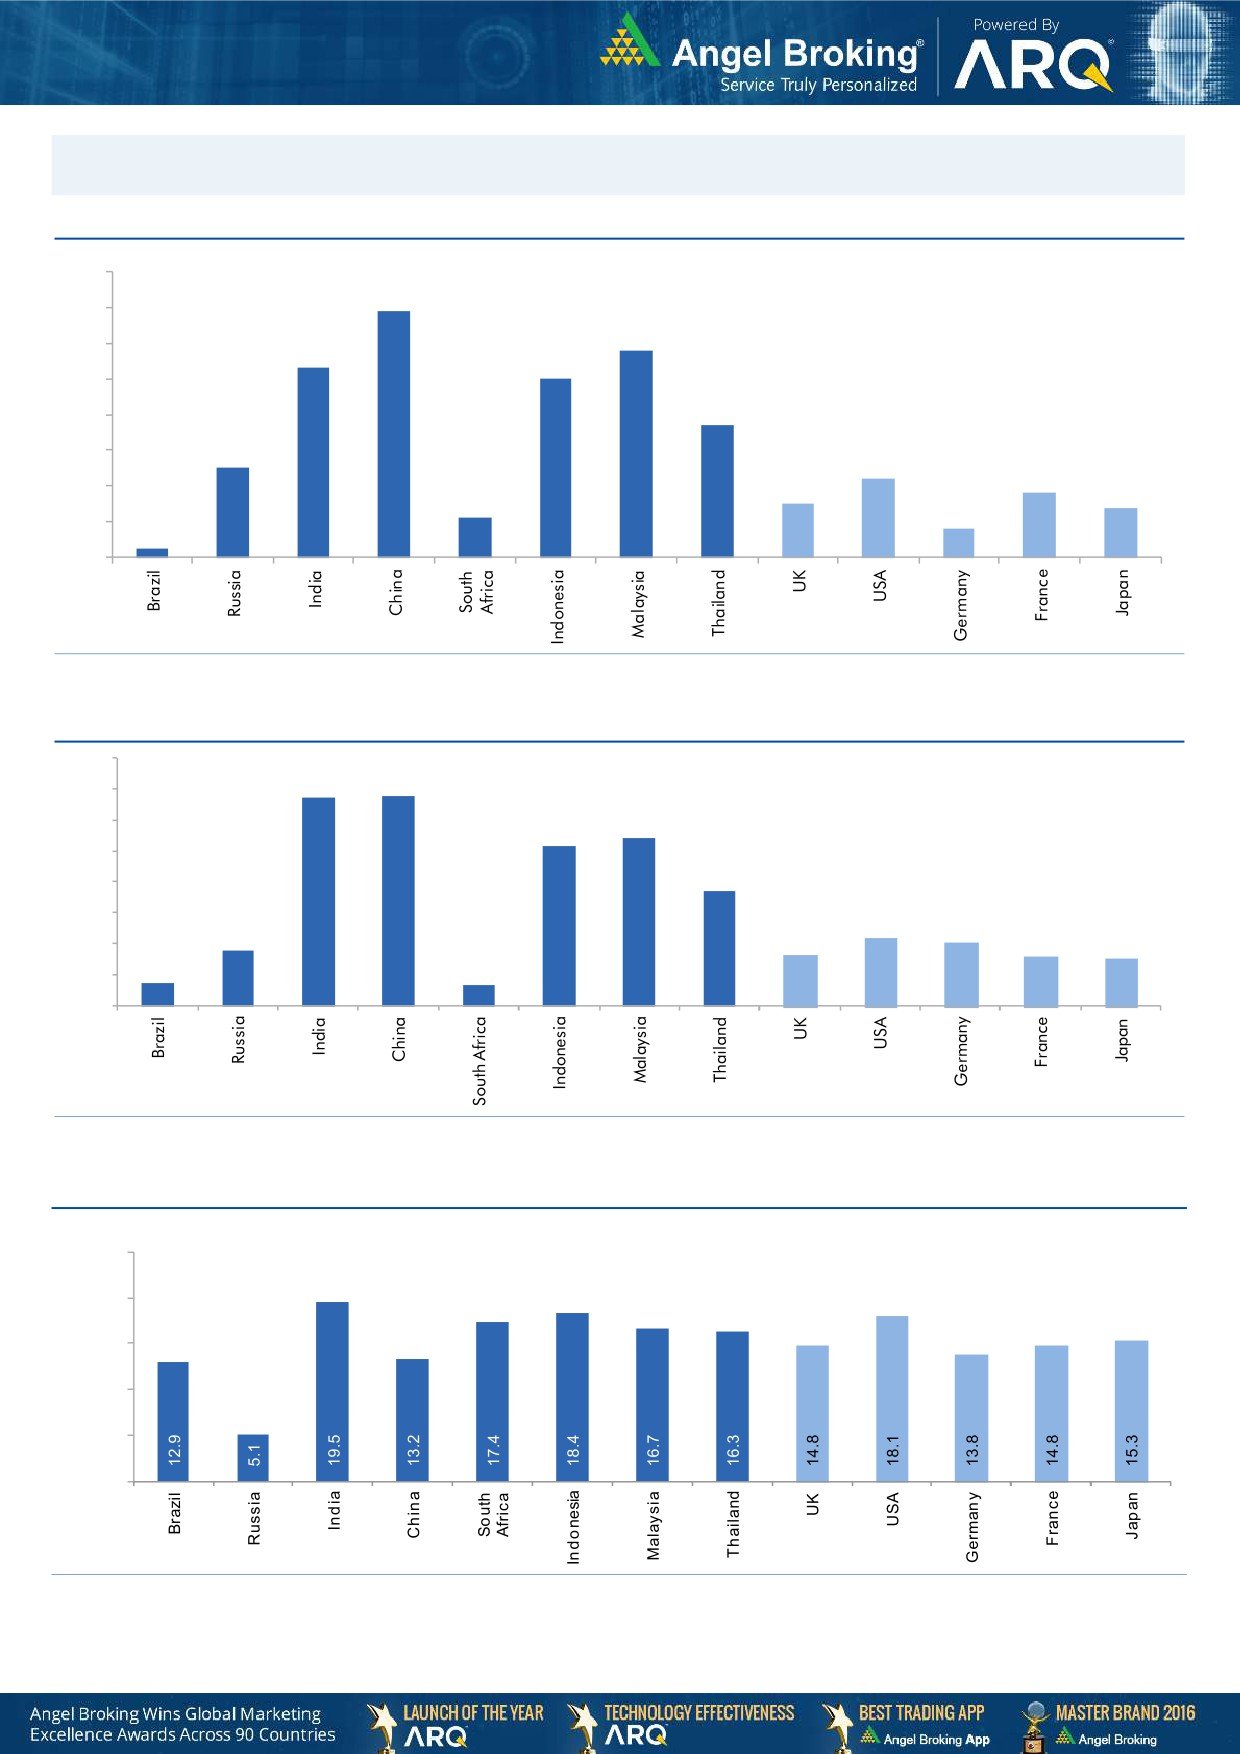
November 30, 2017
Global watch
Exhibit 1: Latest quarterly GDP Growth (%, yoy) across select developing and developed countries
(%)
8.0
6.9
7.0
5.8
6.0
5.3
5.0
5.0
1.1
3.7
4.0
2.5
3.0
2.2
1.8
2.0
1.5
1.4
0.8
1.0
0.3
-
Source: Bloomberg, Angel Research
Exhibit 2: 2017 GDP Growth projection by IMF (%, yoy) across select developing and developed countries
(%)
6.7
6.8
7.0
6.0
5.4
5.2
5.0
3.7
4.0
3.0
1.8
2.2
2.0
1.7
1.6
2.0
0.7
1.5
0.7
1.0
-
Source: IMF, Angel Research
Exhibit 3: One year forward P-E ratio across select developing and developed countries
(x)
25.0
20.0
15.0
10.0
5.0
-
Source: IMF, Angel Research
Market Outlook
November 30, 2017
Exhibit 4: Relative performance of indices across globe
Returns (%)
Country
Name of index
Closing price
1M
3M
1YR
Brazil
Bovespa
72,700
(2.9)
5.2
19.6
Russia
Micex
2,124
2.8
5.9
0.3
India
Nifty
10,361
(0.0)
5.8
27.5
China
Shanghai Composite
3,338
(1.5)
2.0
3.7
South Africa
Top 40
53,957
2.9
8.7
22.1
Mexico
Mexbol
47,623
(3.4)
(7.9)
4.2
Indonesia
LQ45
1,019
3.4
3.7
19.2
Malaysia
KLCI
1,720
(1.6)
(3.1)
5.7
Thailand
SET 50
1,092
(0.2)
8.0
18.7
USA
Dow Jones
23,941
1.9
9.3
24.7
UK
FTSE
7,394
(1.3)
(0.5)
9.5
Japan
Nikkei
22,597
3.9
16.2
24.4
Germany
DAX
13,062
(0.4)
10.2
25.2
France
CAC
5,398
(1.4)
6.5
15.4
Source: Bloomberg, Angel Research p68in4
Stock Watch
November 30, 2017
Company Name
Reco
CMP
Target
Mkt Cap
Sales ( Čcr )
OPM(%)
EPS (Č)
PER(x)
P/BV(x)
RoE(%)
EV/Sales(x)
(Č)
Price ( Č)
( Č cr )
FY18E FY19E
FY18E
FY19E
FY18E
FY19E
FY18E
FY19E
FY18E
FY19E
FY18E
FY19E
FY18E
FY19E
Agri / Agri Chemical
Rallis
Reduce
245
209
4,766
1,873
2,099
15.0
15.0
9.5
10.5
25.8
23.3
3.9
3.6
15.8
16.0
2.4
2.2
United Phosphorus
Accumulate
753
820
38,267
18,922
21,949
18.0
18.5
36.2
45.6
20.8
16.5
4.4
3.6
22.7
23.8
2.2
1.8
Auto & Auto Ancillary
Ashok Leyland
Accumulate
121
127
35,389
23,339
27,240
10.1
10.8
4.7
6.2
26.0
19.5
5.2
4.6
20.0
23.6
1.5
1.2
Bajaj Auto
Neutral
3,316
-
95,940
23,936
27,955
19.5
20.1
142.7
167.3
23.2
19.8
5.1
4.5
21.8
22.8
3.6
3.0
Bharat Forge
Buy
700
875
32,591
7,637
8,755
21.7
23.2
36.1
47.3
19.4
14.8
3.5
3.0
18.5
20.8
4.1
3.5
Eicher Motors
Neutral
30,235
-
82,307
19,043
22,837
19.5
19.9
835.4
1,019.0
36.2
29.7
13.5
10.4
40.9
37.8
4.2
3.4
Gabriel India
Neutral
186
-
2,672
1,782
2,033
9.7
10.2
7.1
8.9
26.2
21.0
5.3
4.5
21.0
22.2
1.5
1.2
Hero Motocorp
Accumulate
3,657
4,129
73,030
32,239
36,878
16.0
15.6
184.4
206.5
19.8
17.7
6.2
5.5
31.3
30.7
2.0
1.8
Jamna Auto Industries Neutral
62
-
2,458
1,441
1,662
14.4
14.8
13.9
17.6
4.4
3.5
1.2
1.0
30.0
31.0
1.7
1.4
Mahindra and Mahindra Neutral
1,434
-
89,128
46,971
53,816
13.6
14.0
67.7
79.8
21.2
18.0
3.0
2.7
15.0
15.9
1.8
1.5
Maruti
Accumulate
8,669
9,489
261,872
79,470
95,208
15.9
17.2
281.7
363.8
30.8
23.8
6.7
5.4
21.7
22.8
3.0
2.4
Minda Industries
Neutral
1,180
-
10,201
4,328
5,084
11.0
11.9
27.3
36.4
43.3
32.4
9.2
7.2
23.1
25.6
2.4
2.1
Motherson Sumi
Neutral
364
-
76,544
55,937
64,445
10.8
11.4
16.9
21.1
21.5
17.3
4.8
4.9
25.2
25.4
1.4
1.2
Tata Motors
Neutral
414
-
119,608
303,167
343,649
11.8
13.8
33.1
54.7
12.5
7.6
2.1
1.6
16.9
23.0
0.4
0.4
TVS Motor
Neutral
736
-
34,959
13,992
16,216
9.0
9.4
17.1
20.3
43.2
36.3
11.5
8.9
29.7
27.7
2.4
2.1
Amara Raja Batteries
Accumulate
805
858
13,746
6,140
7,122
14.3
15.6
29.3
39.0
27.5
20.6
4.7
3.9
17.1
19.0
2.2
1.9
Exide Industries
Neutral
207
-
17,578
8,689
9,854
15.1
15.2
9.7
11.0
21.4
18.8
3.8
3.4
15.7
16.1
1.8
1.5
Apollo Tyres
Neutral
259
-
14,805
15,739
17,326
13.3
14.6
20.4
26.7
12.7
9.7
1.5
1.4
20.4
26.7
1.2
1.1
Ceat
Neutral
1,816
-
7,347
6,661
7,717
11.1
14.2
116.2
178.2
15.6
10.2
2.7
2.3
15.2
21.3
1.2
1.0
JK Tyres
Neutral
145
-
3,299
8,318
9,239
16.2
16.4
21.0
27.5
6.9
5.3
1.4
1.1
19.1
20.4
0.8
0.7
Swaraj Engines
Neutral
1,966
-
2,442
788
889
16.4
16.5
71.6
81.0
27.5
24.3
7.9
7.4
29.6
31.0
2.8
2.4
Subros
Neutral
263
-
1,578
1,855
2,135
11.6
11.8
10.3
14.7
25.7
18.0
3.9
3.3
15.8
19.1
1.1
0.9
Capital Goods
BEML
Neutral
1,679
-
6,993
4,286
5,194
7.1
8.2
42.9
58.1
39.1
28.9
3.2
2.9
7.6
8.7
1.7
1.4
Bharat Electronics
Neutral
189
-
46,437
10,258
12,470
19.6
19.5
7.3
8.6
25.9
22.0
0.5
0.4
20.4
21.9
4.0
3.3
Voltas
Neutral
643
-
21,261
6,778
8,004
9.6
11.0
17.1
22.4
37.6
28.7
9.0
7.9
17.7
19.8
2.8
2.4
BHEL
Neutral
94
-
34,383
33,200
39,167
6.8
9.5
6.2
11.2
15.1
8.4
0.7
0.7
4.6
8.0
0.6
0.5
Blue Star
Buy
722
867
6,921
5,220
6,207
6.3
6.6
16.8
22.3
43.0
32.4
8.5
7.5
19.9
23.3
1.3
1.1
CG Power and Industrial
Neutral
88
-
5,515
6,555
7,292
7.5
7.5
-
0.8
8,800.0
110.0
1.4
1.4
0.1
1.2
0.9
0.8
Solutions
Greaves Cotton
Neutral
121
-
2,965
1,778
1,993
14.7
15.1
8.1
9.1
15.0
13.3
3.4
3.2
21.8
23.6
1.4
1.3
Stock Watch
November 30, 2017
Company Name
Reco
CMP
Target
Mkt Cap
Sales ( Čcr )
OPM(%)
EPS (Č)
PER(x)
P/BV(x)
RoE(%)
EV/Sales(x)
(Č)
Price ( Č)
( Č cr )
FY18E FY19E
FY18E
FY19E
FY18E
FY19E
FY18E
FY19E
FY18E
FY19E
FY18E
FY19E
FY18E
FY19E
Capital Goods
KEC International
Accumulate
322
350
8,277
9,779
11,113
9.4
9.8
14.2
18.2
22.7
17.7
4.3
3.6
21.1
22.1
1.1
1.0
KEI Industries
Accumulate
388
425
3,040
3,001
3,391
10.0
10.0
13.0
16.1
29.8
24.1
5.4
4.5
18.2
18.7
1.2
1.1
Thermax
Neutral
1,120
-
13,348
4,125
4,747
10.3
10.8
26.7
31.5
42.0
35.6
4.7
4.3
11.2
12.0
3.0
2.6
VATech Wabag
Accumulate
600
681
3,275
3,867
4,126
9.6
10.0
34.9
39.8
17.2
15.1
2.8
2.5
17.7
17.5
0.9
0.8
Cement
ACC
Neutral
1,680
-
31,544
12,255
13,350
13.5
14.3
58.0
66.2
29.0
25.4
3.4
3.2
11.5
12.2
2.6
2.3
Ambuja Cements
Neutral
263
-
52,173
10,250
11,450
17.5
19.0
7.2
8.3
36.5
31.7
2.6
2.5
7.0
7.8
4.9
4.3
India Cements
Neutral
177
-
5,439
6,135
6,750
14.8
15.2
8.5
11.5
20.8
15.4
1.0
1.0
4.8
6.2
1.2
1.1
JK Cement
Neutral
993
-
6,939
4,150
4,775
19.2
20.0
49.0
63.5
20.3
15.6
3.2
2.8
17.0
18.5
2.1
1.8
J K Lakshmi Cement
Neutral
408
-
4,796
3,422
3,757
15.5
17.0
13.5
23.2
30.2
17.6
3.1
2.7
10.8
15.5
1.8
1.6
Orient Cement
Neutral
163
-
3,349
2,215
3,233
16.8
17.0
5.9
6.9
27.7
23.7
2.1
2.0
10.8
10.1
2.5
1.7
UltraTech Cement
Neutral
4,281
-
117,531
28,250
35,150
20.2
23.5
77.5
122.2
55.2
35.0
4.7
4.2
9.6
14.8
4.6
3.7
Construction
KNR Constructions
Neutral
277
-
3,891
1,846
2,203
14.5
14.5
12.1
13.7
22.9
20.3
1.3
1.1
17.5
16.7
2.2
1.8
Larsen & Toubro
Neutral
1,217
-
170,548
95,787
109,476
10.2
11.6
44.5
50.8
27.4
24.0
3.4
3.2
12.9
13.1
2.3
2.1
Gujarat Pipavav Port
Neutral
148
-
7,150
739
842
61.6
62.7
5.1
6.2
29.0
24.1
3.6
3.5
12.7
14.9
9.1
7.9
PNC Infratech
Neutral
189
-
4,852
2,040
2,935
13.0
13.0
6.4
9.0
29.6
21.0
0.8
0.7
9.7
12.2
2.4
1.7
Simplex Infra
Neutral
556
-
2,750
6,012
6,619
11.6
11.7
21.1
31.0
26.4
18.0
1.8
1.7
6.5
8.6
1.0
0.9
Sadbhav Engineering
Neutral
377
-
6,476
3,823
4,426
10.7
10.8
10.3
11.8
36.7
32.0
4.4
3.9
10.1
10.5
2.0
1.8
NBCC
Neutral
264
-
23,792
9,099
12,706
6.4
6.4
7.3
9.6
36.3
27.6
1.6
1.3
27.5
30.5
2.5
1.8
MEP Infra
Neutral
100
-
1,622
2,403
2,910
18.3
16.8
2.4
6.1
42.4
16.4
16.1
10.9
35.2
55.8
1.8
1.5
SIPL
Neutral
136
-
4,773
2,060
2,390
46.8
47.7
(5.8)
(3.1)
5.1
5.8
(14.2)
(2.3)
7.1
6.6
Engineers India
Neutral
184
-
12,426
1,795
2,611
21.1
22.4
5.9
8.1
31.3
22.8
2.2
2.2
12.9
16.1
5.3
3.5
Financials
Axis Bank
Accumulate
549
580
131,703
32,558
35,843
3.5
3.2
27.8
41.0
19.8
13.4
2.1
1.9
11.4
14.9
-
-
Bank of Baroda
Neutral
171
-
39,482
22,533
26,079
2.4
2.4
12.0
20.9
14.3
8.2
0.9
0.9
6.6
11.0
-
-
Canara Bank
Neutral
378
-
22,572
17,925
20,235
2.0
2.1
18.5
36.5
20.4
10.4
0.8
0.7
3.4
6.2
-
-
Can Fin Homes
Neutral
490
-
6,528
586
741
3.5
3.5
107.8
141.0
4.6
3.5
1.0
0.8
24.1
25.6
-
-
Cholamandalam Inv. &
Neutral
1,286
-
20,098
2,826
3,307
6.3
6.3
53.7
64.6
24.0
19.9
4.1
3.5
18.3
18.9
-
-
Fin. Co.
Dewan Housing Finance Buy
618
712
19,387
2,676
3,383
2.4
2.7
37.4
49.7
16.5
12.4
2.2
1.9
13.8
16.2
-
-
Equitas Holdings
Buy
147
235
5,006
1,125
1,380
9.6
9.8
1.5
6.0
98.3
24.6
2.2
2.1
2.4
8.2
-
-
Federal Bank
Accumulate
112
125
22,045
4,896
5,930
2.8
3.1
5.4
7.6
20.9
14.8
1.8
1.6
8.5
11.0
-
-
Stock Watch
November 30, 2017
Company Name
Reco
CMP
Target
Mkt Cap
Sales ( Čcr )
OPM(%)
EPS (Č)
PER(x)
P/BV(x)
RoE(%)
EV/Sales(x)
(Č)
Price ( Č)
( Č cr )
FY18E FY19E
FY18E
FY19E
FY18E
FY19E
FY18E
FY19E
FY18E
FY19E
FY18E
FY19E
FY18E
FY19E
Financials
GIC Housing
Buy
449
655
2,415
376
477
3.6
3.7
33.0
40.0
13.6
11.2
2.4
2.1
20.0
23.0
-
-
HDFC Bank
Neutral
1,870
-
483,669
55,236
63,253
4.5
4.4
68.9
82.4
27.2
22.7
4.7
3.9
18.7
18.5
-
-
ICICI Bank
Neutral
315
-
202,278
42,361
51,378
3.6
3.9
18.4
25.7
17.1
12.3
1.9
1.8
11.3
15.0
-
-
Karur Vysya Bank
Buy
116
180
6,998
3,289
3,630
3.7
3.9
10.8
14.1
10.7
8.2
1.3
1.1
12.5
14.7
-
-
LIC Housing Finance
Accumulate
598
630
30,194
4,895
6,332
3.4
3.7
50.7
66.8
11.8
9.0
2.4
1.9
21.7
23.8
-
-
Punjab Natl.Bank
Neutral
182
-
38,623
23,708
25,758
2.1
2.1
5.9
16.4
30.9
11.1
0.9
0.9
3.0
8.3
-
-
RBL Bank
Neutral
521
-
21,696
2,309
2,888
2.6
2.5
16.4
19.1
31.9
27.3
4.0
3.6
13.3
13.8
-
-
Repco Home Finance
Buy
631
825
3,948
496
597
4.4
4.2
38.5
48.7
16.4
13.0
2.9
2.4
19.6
20.6
-
-
South Ind.Bank
Neutral
33
-
5,932
3,195
3,567
3.0
3.1
3.0
3.8
10.9
8.6
1.1
1.0
10.5
11.9
-
-
St Bk of India
Neutral
329
-
283,822
105,827
121,056
2.4
2.5
16.1
25.6
20.4
12.9
1.6
1.5
6.6
9.9
-
-
Union Bank
Neutral
164
-
11,895
14,650
16,225
2.3
2.3
23.1
32.5
7.1
5.0
0.5
0.5
7.1
9.2
-
-
Yes Bank
Neutral
312
-
71,754
11,088
13,138
3.0
2.9
84.0
99.3
3.7
3.1
0.6
0.5
16.3
16.8
-
-
FMCG
Akzo Nobel India
Neutral
1,795
-
8,609
3,164
3,607
13.8
13.7
58.6
67.9
30.6
26.4
7.5
6.6
24.5
25.1
2.6
2.2
Asian Paints
Neutral
1,156
-
110,902
17,603
20,615
18.6
18.6
2,128.9
2,543.3
0.5
0.5
11.5
9.6
28.0
28.9
6.1
5.1
Britannia
Neutral
4,810
-
57,744
9,690
11,278
14.8
15.4
84.0
101.0
57.3
47.6
20.9
16.6
40.6
39.0
5.9
5.1
Colgate
Neutral
1,047
-
28,470
4,420
5,074
24.9
25.3
28.6
32.8
36.6
31.9
14.4
11.7
43.8
40.5
6.2
5.4
Dabur India
Neutral
339
-
59,786
8,346
9,344
19.6
19.9
7.8
9.0
43.5
37.7
8.8
7.9
25.2
24.8
6.8
6.0
GlaxoSmith Con*
Neutral
6,076
-
25,554
5,072
5,760
18.2
18.4
176.3
199.2
34.5
30.5
7.3
6.6
21.2
21.7
4.4
3.8
Godrej Consumer
Neutral
977
-
66,562
10,171
11,682
20.8
21.5
21.7
27.1
45.0
36.1
10.1
8.7
22.3
23.4
6.7
5.7
HUL
Neutral
1,277
-
276,480
37,077
41,508
20.3
21.8
5,189.9
6,318.5
0.3
0.2
38.9
33.3
74.8
82.0
7.3
6.5
ITC
Neutral
258
-
314,569
44,588
49,853
37.0
37.3
9.6
11.0
26.9
23.5
6.6
6.3
25.1
27.3
6.5
5.8
Marico
Neutral
311
-
40,104
6,788
7,766
18.5
19.2
7.1
8.5
43.8
36.6
15.3
13.1
36.9
38.0
5.8
5.0
Nestle*
Neutral
7,502
-
72,328
10,083
11,182
20.0
20.9
119.7
141.3
62.7
53.1
220.9
201.9
36.7
39.8
6.9
6.1
Tata Global
Neutral
280
-
17,684
7,121
7,641
11.9
12.3
6.9
8.0
40.6
35.0
2.7
2.6
6.8
7.2
2.3
2.1
Procter & Gamble
Neutral
9,322
-
30,260
3,034
3,579
27.1
27.7
167.7
198.8
55.6
46.9
14.9
12.9
28.8
29.5
9.4
7.9
Hygiene
IT
HCL Tech^
Buy
853
1,014
121,786
50,009
54,608
22.1
22.1
62.8
67.6
13.6
12.6
3.1
2.6
22.4
20.6
2.1
1.8
Infosys
Accumulate
983
1,120
225,863
70,333
75,960
26.0
26.0
61.7
65.9
15.9
14.9
3.0
2.8
18.9
18.7
2.6
2.4
TCS
Reduce
2,659
2,442
508,923
123,384
134,488
26.1
26.1
133.2
143.7
20.0
18.5
5.5
5.1
27.6
27.8
3.8
3.4
Tech Mahindra
Accumulate
496
526
48,460
30,545
32,988
15.0
15.0
35.2
37.6
14.1
13.2
2.4
2.2
16.8
16.2
1.4
1.2
Stock Watch
November 30, 2017
Company Name
Reco
CMP
Target
Mkt Cap
Sales ( Čcr )
OPM(%)
EPS (Č)
PER(x)
P/BV(x)
RoE(%)
EV/Sales(x)
(Č)
Price ( Č)
( Č cr )
FY18E FY19E
FY18E
FY19E
FY18E
FY19E
FY18E
FY19E
FY18E
FY19E
FY18E
FY19E
FY18E
FY19E
IT
Wipro
Neutral
298
-
144,979
54,164
56,544
22.3
22.3
18.8
19.5
15.9
15.3
2.5
2.2
15.0
13.6
1.9
1.7
Media
D B Corp
Neutral
364
-
6,692
2,404
2,625
30.5
31.5
23.7
26.9
15.4
13.5
3.6
3.1
23.5
22.8
2.6
2.4
HT Media
Neutral
100
-
2,327
2,589
2,830
15.1
15.4
8.3
10.9
12.1
9.2
1.0
0.9
8.4
10.4
0.4
0.3
Jagran Prakashan
Buy
163
225
5,088
2,541
2,835
28.5
28.7
12.7
14.1
12.9
11.6
2.7
2.3
21.3
21.4
1.9
1.6
Sun TV Network
Neutral
882
-
34,752
3,238
3,789
51.9
55.1
30.9
38.0
28.5
23.2
8.1
7.1
30.0
31.0
10.2
8.6
Hindustan Media
Neutral
247
-
1,816
1,002
1,074
23.3
23.5
29.2
33.8
8.5
7.3
1.3
1.1
15.6
15.4
0.8
0.6
Ventures
TV Today Network
Accumulate
399
435
2,383
667
727
27.7
27.7
18.6
20.1
21.5
19.9
3.3
3.4
15.6
17.3
3.1
2.9
Music Broadcast Limited Buy
374
434
2,132
271
317
91.0
109.0
6.0
10.0
62.3
37.4
3.9
3.5
6.5
9.3
7.5
6.1
Metals & Mining
Coal India
Neutral
276
-
171,604
82,301
91,235
17.0
18.0
17.1
20.5
16.2
13.5
3.0
2.9
45.0
55.0
1.8
1.6
Hind. Zinc
Neutral
304
-
128,260
22,108
24,555
57.0
58.0
22.1
26.3
13.7
11.5
4.5
3.6
32.0
35.0
4.8
4.0
Hindalco
Neutral
247
-
55,401
102,350
105,355
13.5
14.5
21.5
24.5
11.5
10.1
1.6
1.3
15.0
15.2
1.1
1.1
JSW Steel
Neutral
255
-
61,736
64,500
68,245
21.1
21.5
20.1
21.2
12.7
12.1
2.3
2.0
-
-
1.7
1.6
NMDC
Neutral
127
-
40,308
10,209
11,450
47.0
48.0
11.1
12.1
11.5
10.5
1.6
1.5
-
-
3.5
3.1
SAIL
Neutral
78
-
32,339
54,100
63,555
3.0
10.0
(10.0)
1.5
52.2
1.0
1.0
-
-
1.6
1.4
Vedanta
Neutral
298
-
110,902
81,206
87,345
28.0
29.0
26.5
33.5
11.3
8.9
2.6
2.2
-
-
2.1
1.8
Tata Steel
Neutral
709
-
68,888
121,445
126,500
16.2
17.2
65.4
81.3
10.9
8.7
1.7
1.5
-
-
1.1
1.0
Oil & Gas
GAIL
Neutral
462
-
78,104
53,115
52,344
14.2
15.3
30.0
31.1
15.4
14.9
1.9
1.8
-
-
1.2
1.2
ONGC
Neutral
182
-
233,757
83,111
84,934
44.2
44.9
16.4
16.9
11.1
10.8
1.3
1.3
-
-
2.7
2.7
Indian Oil Corp
Neutral
394
-
191,177
396,116
432,560
8.5
8.8
40.1
42.2
9.8
9.3
1.7
1.5
-
-
0.6
0.6
Reliance Industries
Neutral
945
-
614,902
257,711
267,438
17.0
18.2
89.1
89.5
10.6
10.6
1.0
0.9
-
-
2.0
2.0
Pharmaceuticals
Alembic Pharma
Buy
513
600
9,663
3,346
3,915
19.6
19.2
21.0
23.9
24.4
21.5
4.3
3.7
19.1
18.4
2.9
2.5
Alkem Laboratories Ltd
Accumulate
1,957
2,125
23,402
6,320
7,341
17.5
19.8
72.7
96.6
26.9
20.3
4.8
4.0
16.7
18.7
3.6
3.1
Aurobindo Pharma
Buy
709
823
41,545
17,086
19,478
22.1
22.0
44.7
51.4
15.9
13.8
3.5
2.8
24.7
22.7
2.5
2.2
Aventis*
Neutral
4,409
-
10,155
2,411
2,698
18.8
18.8
151.6
163.9
29.1
26.9
4.5
3.7
25.4
27.5
3.8
3.2
Cadila Healthcare
Reduce
440
411
45,029
11,365
12,926
20.0
20.0
18.4
20.5
23.9
21.5
5.3
4.3
24.3
22.2
4.0
3.5
Cipla
Sell
609
462
48,973
16,163
18,711
16.6
16.9
20.7
24.3
29.4
25.0
3.5
3.1
12.6
13.1
3.2
2.7
Dr Reddy's
Reduce
2,276
2,040
37,742
13,734
15,548
17.7
20.2
69.9
102.0
32.6
22.3
2.9
2.6
9.2
12.4
3.0
2.6
GSK Pharma*
Sell
2,454
2,000
20,787
2,968
3,324
13.8
15.9
37.8
46.3
64.9
53.0
11.4
12.5
16.7
22.4
6.8
6.2
Indoco Remedies
Sell
286
136
2,636
1,114
1,297
9.9
13.9
5.6
11.4
51.1
25.1
3.9
3.4
7.7
14.5
2.6
2.2
Stock Watch
November 30, 2017
Company Name
Reco
CMP
Target
Mkt Cap
Sales ( Čcr )
OPM(%)
EPS (Č)
PER(x)
P/BV(x)
RoE(%)
EV/Sales(x)
(Č)
Price ( Č)
( Č cr )
FY18E FY19E
FY18E
FY19E
FY18E
FY19E
FY18E
FY19E
FY18E
FY19E
FY18E
FY19E
FY18E
FY19E
Pharmaceuticals
Ipca labs
Accumulate
537
570
6,777
3,256
3,647
14.1
17.1
16.2
25.4
33.2
21.2
2.6
2.3
8.0
11.5
2.1
1.9
Lupin
Buy
834
1,091
37,703
16,240
18,562
21.3
21.7
42.5
49.6
19.6
16.8
2.5
2.2
13.3
13.7
2.4
2.0
Natco Pharma
Buy
916
1,057
15,976
1,886
2,016
32.3
29.5
23.2
22.0
39.6
41.5
8.3
7.3
20.9
17.6
8.3
7.8
Sun Pharma
Accumulate
548
615
131,455
28,312
31,826
20.7
22.4
18.5
22.3
29.6
24.6
3.4
3.0
11.5
14.0
4.3
3.7
Syngene International
Neutral
553
-
11,057
1,394
1,818
33.0
36.0
15.8
20.6
34.9
26.8
6.5
5.4
18.6
20.0
7.9
6.1
Power
Tata Power
Neutral
95
-
25,709
32,547
33,806
20.5
20.5
4.7
5.4
20.2
17.8
1.9
1.7
10.5
10.5
1.8
1.7
NTPC
Neutral
182
-
149,944
86,070
101,246
28.3
30.7
12.9
16.2
14.1
11.2
1.5
1.3
10.6
12.4
3.1
2.8
Power Grid
Accumulate
209
223
109,236
29,183
32,946
89.7
90.0
18.0
20.8
11.6
10.0
1.9
1.7
17.7
18.2
7.7
7.1
Real Estate
Prestige Estate
Neutral
326
-
12,219
4,607
5,146
21.0
22.2
7.9
9.8
41.3
33.3
2.5
2.4
10.3
12.0
3.8
3.5
MLIFE
Accumulate
487
522
2,497
487
590
12.3
17.8
21.0
31.2
23.2
15.6
1.2
1.2
5.2
7.4
3.8
3.1
Telecom
Bharti Airtel
Neutral
496
-
198,151
97,903
105,233
36.0
36.3
9.3
11.1
53.3
44.9
2.6
2.4
5.0
5.6
3.0
2.7
Idea Cellular
Neutral
94
-
33,746
35,012
37,689
27.1
27.7
(4.4)
(2.7)
1.5
1.5
(6.8)
(4.6)
2.3
2.0
zOthers
Abbott India
Neutral
5,094
-
10,825
3,244
3,723
14.9
16.1
167.5
209.4
30.4
24.3
6.7
5.6
23.7
24.8
3.0
2.5
Asian Granito
Accumulate
505
570
1,519
1,169
1,286
12.5
12.5
16.0
19.7
31.6
25.6
3.4
3.0
10.7
11.6
1.5
1.4
Bajaj Electricals
Neutral
480
-
4,877
4,646
5,301
6.7
7.6
16.1
22.3
29.8
21.5
4.9
4.1
16.4
19.2
1.0
0.9
Banco Products (India)
Neutral
251
-
1,797
1,530
1,695
13.2
12.7
19.0
20.0
13.2
12.6
2.1
1.9
0.2
0.2
1.1
121.2
Coffee Day Enterprises
Neutral
239
-
4,914
3,494
3,913
17.4
18.0
4.8
5.7
-
41.9
2.1
2.0
-
0.1
1.9
1.6
Ltd
Elecon Engineering
Neutral
80
-
892
171
201
15.0
16.2
36.0
43.0
2.2
1.9
0.2
0.2
0.1
0.1
4.6
3.9
Garware Wall Ropes
Neutral
910
-
1,992
928
1,003
15.2
15.2
39.4
43.2
23.1
21.1
3.8
3.3
16.5
15.4
2.0
1.8
Goodyear India*
Neutral
863
-
1,990
1,717
1,866
11.8
12.3
47.9
49.8
18.0
17.3
2.8
2.4
15.6
15.7
0.9
122.4
Hitachi
Neutral
2,593
-
7,050
2,355
2,715
10.3
10.8
49.0
60.9
52.9
42.6
12.4
9.8
0.2
0.2
3.0
2.6
HSIL
Neutral
527
-
3,813
2,240
2,670
14.6
15.0
17.0
22.0
31.0
24.0
2.6
2.4
0.1
0.1
1.9
1.6
Interglobe Aviation
Neutral
1,154
-
44,331
22,570
27,955
14.2
15.0
63.6
81.8
18.2
14.1
9.6
8.1
0.5
0.6
1.6
1.2
Jyothy Laboratories
Neutral
386
-
7,016
1,781
2,044
14.1
15.0
9.4
10.5
41.3
36.8
8.8
8.3
0.2
0.2
4.2
3.6
Linc Pen & Plastics
Neutral
293
-
433
420
462
9.3
9.3
15.3
17.1
19.2
17.1
3.2
3.3
16.9
19.5
1.1
1.0
M M Forgings
Neutral
897
-
1,083
542
642
20.1
21.0
41.6
56.8
21.6
15.8
3.0
2.5
0.1
0.2
2.4
2.1
Mirza International
Neutral
160
-
1,928
1,148
1,285
18.0
18.0
8.0
9.4
19.9
17.1
3.3
2.8
16.3
16.1
1.8
1.6
Navkar Corporation
Buy
185
265
2,785
561
617
41.5
41.5
11.5
12.7
16.1
14.6
1.7
1.5
10.5
10.4
5.6
4.9
Nilkamal
Neutral
1,799
-
2,684
2,317
2,525
11.4
11.1
96.0
105.0
18.7
17.1
3.2
2.8
0.2
0.2
1.1
1.0
Stock Watch
November 30, 2017
Company Name
Reco
CMP
Target Mkt Cap
Sales ( Čcr )
OPM(%)
EPS (Č)
PER(x)
P/BV(x)
RoE(%)
EV/Sales(x)
(Č)
Price ( Č)
( Č cr )
FY18E FY19E FY18E FY19E FY18E FY19E FY18E FY19E FY18E FY19E FY18E FY19E FY18E FY19E
zOthers
Parag Milk Foods
Neutral
237
-
1,997
1,987
2,379
7.6
9.0
12.4
18.3
19.2
13.0
2.7
2.4
8.2
13.2
1.1
1.0
Radico Khaitan
Neutral
279
-
3,722
1,811
1,992
13.2
13.2
8.1
8.8
34.5
31.7
3.5
3.8
10.1
12.0
2.4
2.2
Relaxo Footwears
Neutral
603
-
7,258
1,981
2,310
13.7
14.5
12.0
15.5
50.3
38.9
9.8
7.9
0.2
0.2
3.7
3.2
Siyaram Silk Mills
Neutral
664
-
3,111
1,769
1,981
12.7
12.7
22.6
26.2
29.3
25.3
4.5
3.9
15.5
15.5
1.9
1.7
Styrolution ABS India* Neutral
1,109
-
1,949
1,800
1,980
8.0
8.1
42.0
46.2
26.4
24.0
3.0
2.6
0.1
0.1
1.2
1.1
Surya Roshni
Neutral
381
-
1,668
4,870
5,320
7.7
7.8
22.8
28.1
16.7
13.5
2.2
1.9
0.1
0.1
0.6
0.5
TVS Srichakra
Neutral
3,403
-
2,606
2,729
2,893
12.7
12.5
248.5
265.0
13.7
12.8
3.9
3.2
0.3
0.3
1.0
0.9
Visaka Industries
Neutral
635
-
1,009
1,104
1,214
12.1
12.6
31.0
37.9
20.5
16.8
2.5
2.2
0.1
0.1
1.1
1.0
VIP Industries
Accumulate
354
400
4,998
1,450
1,693
10.4
10.5
6.5
7.8
54.1
45.3
11.4
10.0
21.1
22.1
3.4
2.9
Navin Fluorine
Neutral
697
-
3,439
945
1,154
22.4
22.6
28.7
34.8
24.3
20.1
4.0
3.4
-
-
3.2
2.5
Source: Company, Angel Research; Note: *December year end; #September year end; &October year end; Price as on November 29, 2017
Market Outlook
November 30, 2017
Research Team Tel: 022 - 39357800
DISCLAIMER
Angel Broking Private Limited (hereinafter referred to as “Angel”) is a registered Member of National Stock Exchange of India
Limited,Bombay Stock Exchange Limited and Metropolitan Stock Exchange Limited. It is also registered as a Depository Participant with
CDSL and Portfolio Manager with SEBI. It also has registration with AMFI as a Mutual Fund Distributor. Angel Broking Private Limited is a
registered entity with SEBI for Research Analyst in terms of SEBI (Research Analyst) Regulations, 2014 vide registration number
INH000000164. Angel or its associates has not been debarred/ suspended by SEBI or any other regulatory authority for accessing
/dealing in securities Market. Angel or its associates/analyst has not received any compensation / managed or
co-managed public offering of securities of the company covered by Analyst during the past twelve months.
This document is solely for the personal information of the recipient, and must not be singularly used as the basis of any investment
decision. Nothing in this document should be construed as investment or financial advice. Each recipient of this document should make
such investigations as they deem necessary to arrive at an independent evaluation of an investment in the securities of the companies
referred to in this document (including the merits and risks involved), and should consult their own advisors to determine the merits and
risks of such an investment.
Reports based on technical and derivative analysis center on studying charts of a stock's price movement, outstanding positions and
trading volume, as opposed to focusing on a company's fundamentals and, as such, may not match with a report on a company's
fundamentals. Investors are advised to refer the Fundamental and Technical Research Reports available on our website to evaluate the
contrary view, if any.
The information in this document has been printed on the basis of publicly available information, internal data and other reliable
sources believed to be true, but we do not represent that it is accurate or complete and it should not be relied on as such, as this
document is for general guidance only. Angel Broking Pvt. Limited or any of its affiliates/ group companies shall not be in any way
responsible for any loss or damage that may arise to any person from any inadvertent error in the information contained in this report.
Angel Broking Pvt. Limited has not independently verified all the information contained within this document. Accordingly, we cannot
testify, nor make any representation or warranty, express or implied, to the accuracy, contents or data contained within this document.
While Angel Broking Pvt. Limited endeavors to update on a reasonable basis the information discussed in this material, there may be
regulatory, compliance, or other reasons that prevent us from doing so.
This document is being supplied to you solely for your information, and its contents, information or data may not be reproduced,
redistributed or passed on, directly or indirectly.
Neither Angel Broking Pvt. Limited, nor its directors, employees or affiliates shall be liable for any loss or damage that may arise from
or in connection with the use of this information.